

Once data has been collected and prepared, you’re well ready for the next stage of analysis. Data analysis involves systematically examining the evidence to identify patterns, relationships, differences, meanings, or explanations that help answer the research question.
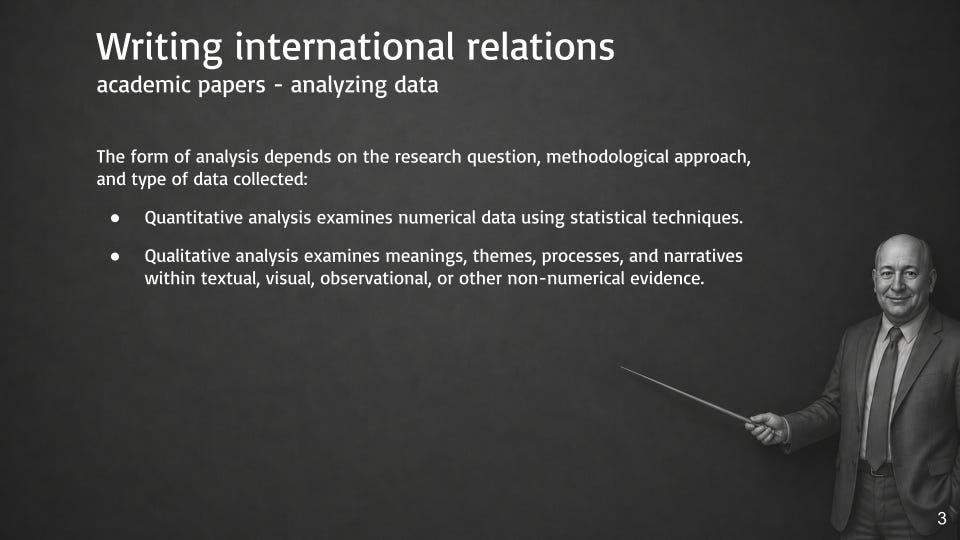
The form of analysis depends on the research question, methodological approach, and type of data collected:
Quantitative analysis examines numerical data using statistical techniques.
Qualitative analysis examines meanings, themes, processes, and narratives within textual, visual, observational, or other non-numerical evidence.
Quantitative data analysis
Quantitative analysis uses statistical techniques to describe data and examine relationships between variables. Analysis normally begins with individual variables before moving to relationships between two or more variables.
Univariate analysis examines one variable at a time. Its purpose is to describe the characteristics and distribution of that variable before examining relationships with other variables. Common techniques include:
Frequency and percentage - how often different values or categories occur.
Mean, median, and mode - measures of the typical or central value.
Range and standard deviation - measures of how widely values are distributed.
Tables and graphs - visual representations of the distribution of a variable.
For example, a survey of attitudes towards an alliance might first establish the percentage of respondents who support or oppose the alliance and calculate the average level of support.
Bivariate analysis examines the relationship between two variables. Researchers use it to determine whether differences or changes in one variable are associated with differences or changes in another.
For example, a researcher might examine whether age is associated with support for an alliance, or whether economic dependence is associated with foreign policy behaviour. Common techniques include cross-tabulation, comparison of means, and correlation.
A measure of association indicates the strength and sometimes the direction of the relationship between variables. A stronger association means that knowing the value of one variable provides more information about the likely value of another.
Examines two variables - looks at whether two variables are related.
Direction - determines whether the relationship is positive, negative, or absent.
Strength - considers how closely the two variables are related.
Common techniques - cross-tabulation, correlation, and simple regression.
Correlation ≠ causation - a relationship between two variables does not necessarily mean that one causes the other.
The appropriate measure depends on the type of variables being analysed. Common measures include Pearson’s correlation coefficient, Spearman’s rank correlation, chi-square tests.
Researchers must remember that association does not by itself demonstrate causation. A statistical relationship may be caused by another variable, operate in the opposite direction from that expected, or occur by chance. Statistical results therefore need to be interpreted in relation to the research question, theory, and research design.
Qualitative data analysis
Qualitative analysis involves systematically examining evidence to identify meanings, patterns, themes, processes, and interpretations. The researcher normally begins by organising and reading the collected material before coding, categorising, comparing, and interpreting it.
Three common approaches are content analysis, thematic analysis, and narrative analysis.
Content analysis
Content analysis systematically examines the content of documents, speeches, interviews, media, social media, images, or other material. Researchers develop categories or codes and apply them consistently to the evidence. The process generally involves:
Define the material to be analysed.
Establish the unit of analysis, such as words, sentences, paragraphs, statements, or documents.
Develop categories or codes.
Code the material systematically.
Compare patterns across the evidence.
Interpret the findings in relation to the research question.
Content analysis can be quantitative, such as counting how frequently particular terms appear, or qualitative, examining how particular ideas or concepts are represented.
Thematic analysis
Thematic analysis identifies recurring patterns of meaning, or themes, within qualitative data. It is particularly useful for analysing interviews, observations, open-ended survey responses, and documents. The process generally involves:
Become familiar with the data.
Identify and code relevant passages.
Group related codes into possible themes.
Review and refine the themes.
Define what each theme represents.
Interpret how the themes help answer the research question.
Themes should emerge from systematic engagement with the evidence rather than simply reflecting what the researcher expected to find.
Thematic analysis is a qualitative method used to identify and interpret recurring patterns of meaning, or themes, within qualitative data. It is commonly used with interviews, observations, open-ended survey responses, documents, and other forms of textual evidence.
The researcher begins by becoming familiar with the data and identifying passages that are relevant to the research question. These passages are assigned codes, which are short labels describing important ideas or meanings. Related codes are then grouped together to develop broader themes. For example, interviews about attitudes towards a military alliance might produce codes such as security, dependence, cost, trust, and national autonomy. These might then be organised into broader themes such as security benefits, concerns about dependence, and national identity.
The thematic analysis process generally follows six steps:
Become familiar with the data - read and review the collected material carefully.
Develop initial codes - label passages containing relevant ideas, experiences, or meanings.
Identify possible themes - group related codes into broader patterns.
Review the themes - check whether the themes accurately reflect the evidence.
Define the themes - clearly explain what each theme represents and how it differs from other themes.
Interpret the findings - examine how the themes relate to one another and how they help answer the research question.
The main strength of thematic analysis is its flexibility. It allows researchers to identify patterns across large amounts of qualitative material while still paying attention to context and meaning. Its main limitation is that coding and identifying themes involve researcher judgement. Researchers should therefore clearly explain how codes and themes were developed and support their interpretations with evidence from the data.
Narrative analysis
Narrative analysis examines how people or organisations construct and communicate stories about events, experiences, identities, or processes. Rather than breaking evidence entirely into separate themes, narrative analysis pays attention to how different elements are connected into a larger account.
Researchers might examine how political leaders tell the story of a country’s history, how diplomats describe a negotiation, or how individuals explain changes in their political attitudes. The process generally involves:
Identify the narratives relevant to the research question.
Examine how the narrative is structured.
Identify important actors, events, turning points, and themes.
Consider how events are connected and given meaning.
Examine what is emphasized, excluded, or presented as causing particular outcomes.
Interpret the narrative within its wider political, historical, or social context.
The central task in both quantitative and qualitative analysis is to move systematically from raw evidence to findings that answer the research question. Researchers should be able to explain not only what they found, but also how their method of analysis produced those findings.
The guided academic paper - analyzing data
You should now decide how you will analyse the data collected for your guided academic paper. Your choice should follow from your research question, methodological approach, and the type of data you intend to collect.
If you are using quantitative data, identify the univariate and, where appropriate, bivariate techniques you will use. Consider what variables you will describe, which relationships you will examine, and whether measures of association such as Pearson’s correlation, Spearman’s rank correlation, or chi-square are appropriate.
If you are using qualitative data, decide whether you will use content, thematic, or narrative or any other form of analysis. Explain how you will organise and code your evidence and how you will identify the patterns, themes, or narratives needed to answer your research question. In your research diary, record:
the type of analysis you will use;
why it is appropriate for your research question and data;
the specific statistical techniques or qualitative approach you will use;
the main variables, categories, codes, themes, or narratives you expect to examine; and
any limitations or problems you anticipate.
Your analysis plan should explain clearly how you will move from the data you collect to findings that answer your research question.

Support an academic - Buy me a Coffee